Accuracy
How accurate is GradeDrive, really?
Two different kinds of evidence sit behind that question: what our own production marking shows week to week, and two academic-style case studies that test GradeDrive against official exam board marks and real examiners. Here is both, with the methodology and the limits of each laid out plainly.
99.2% of marks survived a teacher’s review unchanged.
Across summer 2026, GradeDrive processed 216,000 marks over 2,300 submissions. Every one of those marks was shown to a teacher, next to the student’s answer and the mark scheme criterion it matched, before it counted for anything. 99.2% of them survived that review exactly as GradeDrive first suggested. About 700 submissions had at least one mark changed, an average of around 2.5 marks changed per paper among that group, 1,750 marks in total out of the 216,000 awarded.
This is our own measure, drawn from our own production database, of how often a mark survives a teacher’s review unchanged. It is not an independently verified accuracy benchmark: there is no chief-examiner comparison or external audit behind it, and it measures agreement with a teacher’s own judgement on review, not agreement with an external standard like an exam board’s mark scheme. Our target for 2027 is 99.5% and higher.
Testing GradeDrive against the exam board and the examiners.
To get a harder, outside-style read on marking accuracy specifically, not just review agreement, GradeDrive’s Ismail Bozdag worked with independent researcher Dr Manting Qiu on two case studies comparing GradeDrive’s marks against official AQA mark schemes. Both are posted on SSRN and disclose Ismail’s GradeDrive affiliation as a conflict of interest on their first page.
A case study in GCSE Physics
The dataset was 71 previously marked AQA GCSE Physics (8463) responses, drawn from AQA’s own examiner-training material across the 2019, 2022 and 2023 series. AQA selects this material specifically as edge cases, questions where its own experienced examiners are known to disagree when marking, so it is a harder test than a random sample of scripts would be. AQA’s mark was treated as the main reference standard, and a panel of six independent physics teachers separately re-marked all 71 items, not only the disputed ones, as a cross-check.
GradeDrive’s marks agreed with AQA’s at a quadratic-weighted kappa of 0.885, an ICC of 0.887 and a Pearson correlation of 0.903, with exact agreement on 77.5% of items and agreement within one mark on 91.5%. The paper compares that to published examiner-to-examiner agreement on similar short-answer items, around 78% in a 2013 Ofqual study, and GradeDrive’s figure lands almost exactly there. On the 16 items where GradeDrive and AQA disagreed, the independent teacher panel sided with GradeDrive’s mark slightly more often than AQA’s (9 of 16 against 5, with 2 ties), though the paper is careful to note that difference does not reach statistical significance on a sample this size.
It also reports where GradeDrive was less accurate: marks ran about 0.3 higher than AQA’s on average, over-marking on 21% of items and under-marking on only 1%. Because the sample was deliberately the most contentious material AQA has, the paper says directly that these figures describe performance on unusually hard material, not GCSE Physics marking in general.
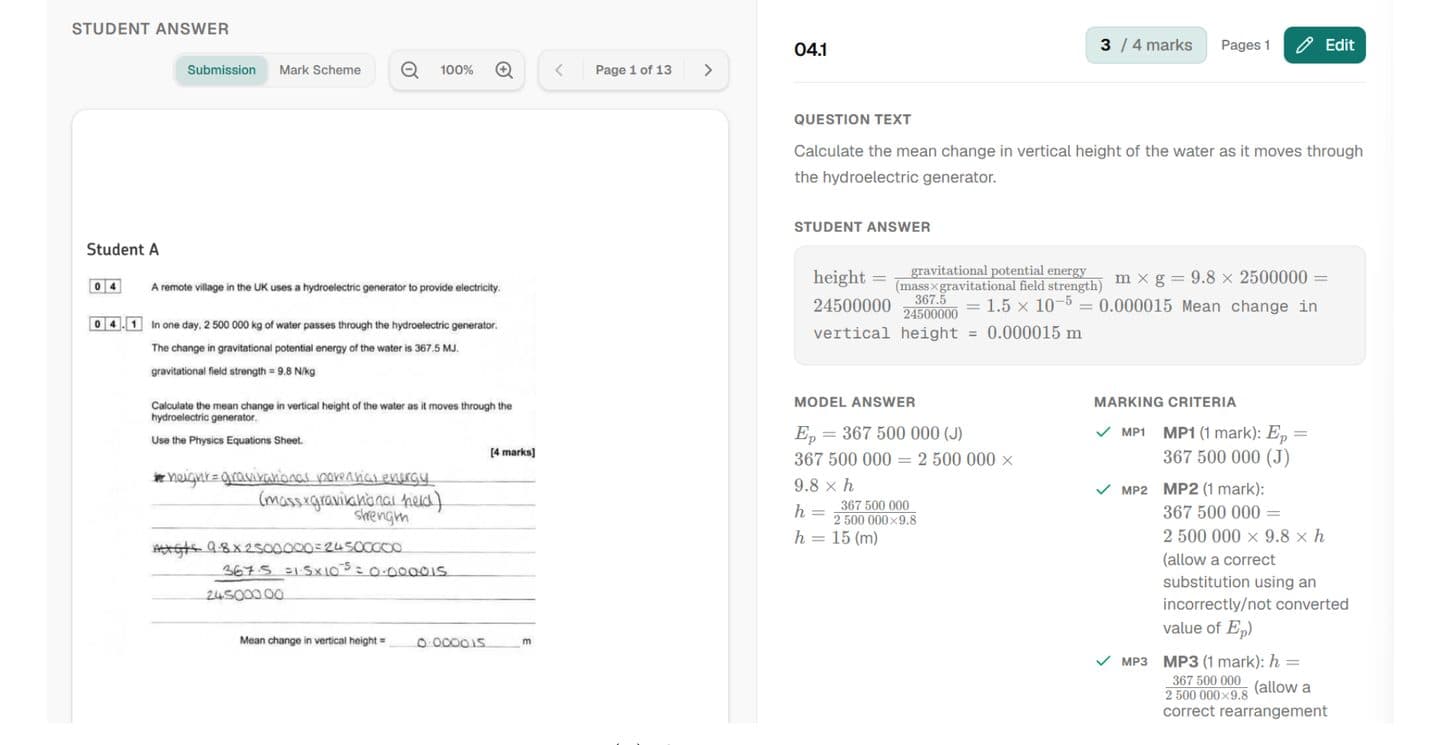
From Appendix A of the Physics paper: Question 4.1, a 4-mark calculation. GradeDrive's production interface, unedited by a human reviewer.
| Quadratic-weighted kappa | 0.885 |
|---|---|
| ICC | 0.887 |
| Pearson correlation (r) | 0.903 |
| Exact agreement with AQA | 77.5% |
| Agreement within 1 mark | 91.5% |
| Mean difference vs AQA | +0.3 marks (GradeDrive higher) |
Bozdag, I. and Qiu, M. “Comparing the Marking Accuracy of an AI Marking System with Official Examination Board Marks and Experienced Teacher Judgement: A Case Study in GCSE Physics.” SSRN, September 2026.
A case study in A-level Mathematics
This study extended the same approach to 185 question parts from 26 student scripts across AQA A-level Mathematics (7357) Papers 1 to 3, again drawn from AQA’s own training material and deliberately contentious. It also asked a second question: does GradeDrive give the same mark if the same script is submitted twice? Eighteen of the 26 scripts were marked three times each, independently, to find out.
Agreement with AQA was a quadratic-weighted kappa of 0.864, an ICC of 0.865 and a Pearson correlation of 0.884, with exact agreement on 70.3% of parts and agreement within one mark on 93.0%. Against the same human-examiner benchmarks, that sits between the published range for short, objective items (around 78%) and longer extended-response items (around 33%), closer to the short-item figure. Re-marking the same script three times produced closely consistent totals: 7 of 18 scripts scored identically every time, and the typical script’s total moved by under a mark between runs. That run-to-run variation was about a fifth the size of GradeDrive’s average difference from AQA, so marking the same script again is unlikely to change its outcome much.
The same generosity pattern showed up here too: marks ran about 0.3 higher per question part than AQA’s on average, concentrated on responses AQA judged weak or worth zero credit. Unlike the Physics study, no independent teacher panel was used here, so there is no cross-check on whether AQA or GradeDrive was closer to right where the two disagreed.
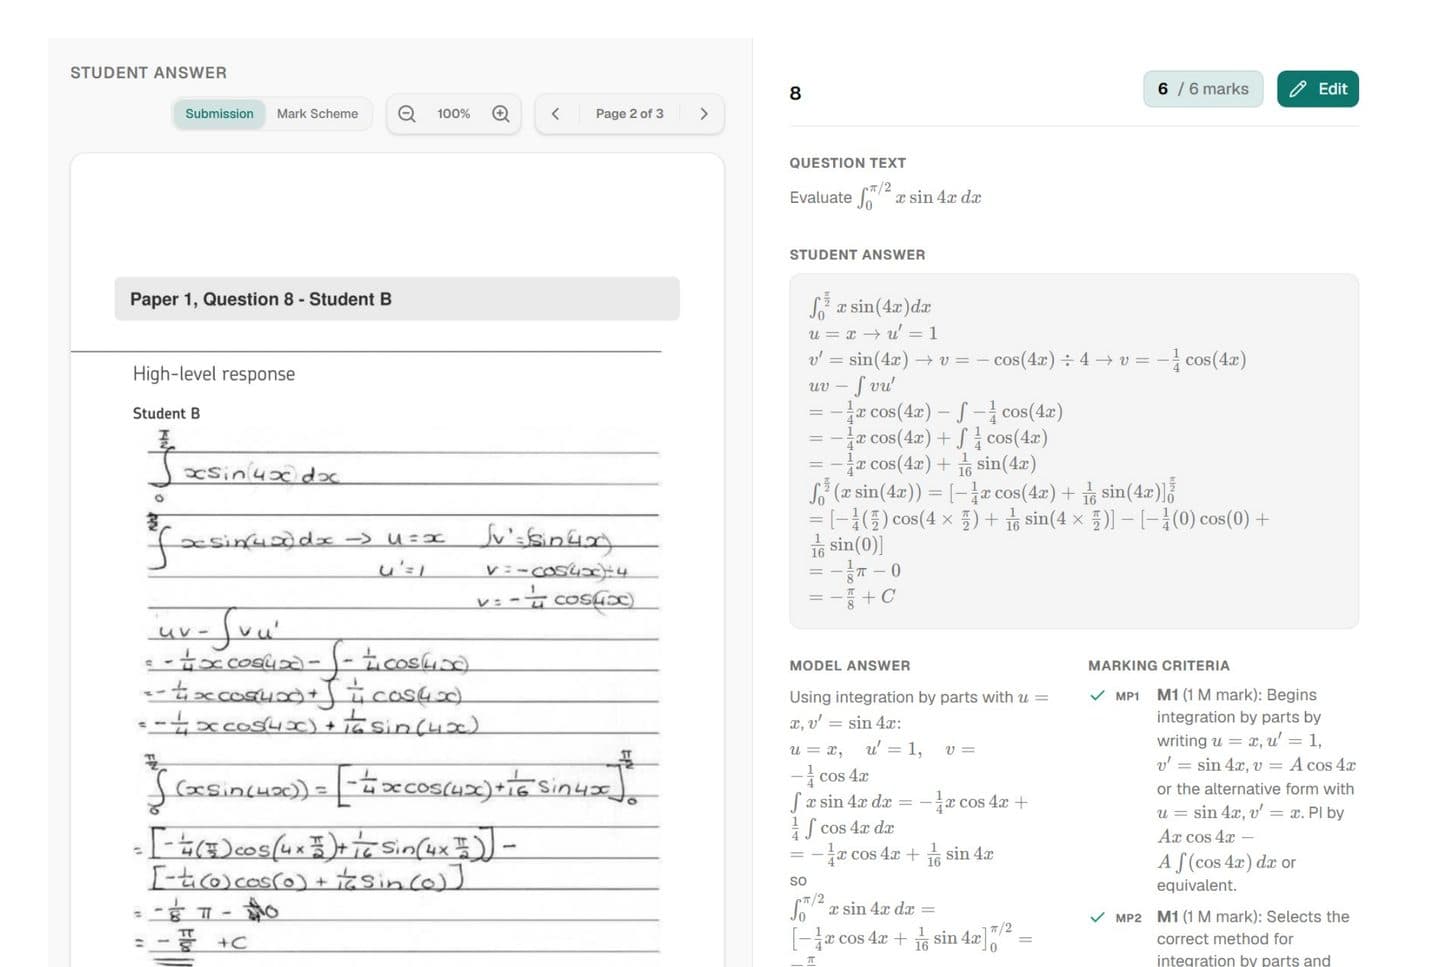
From Figure 1 of the Maths paper: Paper 1 (2023) Q8, a 6-mark definite integral. GradeDrive awarded 6/6; AQA awarded 5. The paper notes the student's final line adds a constant of integration to a definite integral, the kind of detail markers can differ on.
| Quadratic-weighted kappa | 0.864 |
|---|---|
| ICC (vs AQA) | 0.865 |
| Pearson correlation (r) | 0.884 |
| Exact agreement with AQA | 70.3% |
| Agreement within 1 mark | 93.0% |
| Mean difference vs AQA | +0.3 marks per part (GradeDrive higher) |
| Run-to-run reliability (ICC) | 0.994 |
Bozdag, I. and Qiu, M. “Agreement and Run-to-Run Consistency of an AI Marking System against Examination Board Marks: A Case Study in A-level Mathematics.” SSRN, September 2026.
Different measures, different questions.
The 99.2% figure and the case study numbers are not in tension, they measure different things. The 99.2% figure is how often a teacher’s own review agrees with GradeDrive’s suggested mark, across the ordinary, day-to-day marking of a whole summer. The case studies measure something narrower and harder: agreement with the official exam board mark, specifically on material AQA chose because its own examiners find it hardest to mark consistently. Lower numbers there are a stricter test on harder material, not a contradiction of the higher one.
Quadratic-weighted kappa and the intraclass correlation coefficient (ICC) are standard ways assessment researchers measure agreement between two markers, correcting for the agreement you would expect by chance. Both papers report a full battery of these statistics, including Pearson correlation, mean absolute error, and Bland-Altman limits of agreement, rather than a single headline number, so the results can be checked rather than taken on trust. Both also publish a limitations section covering sample size, the non-representative edge-case material, and the model behind GradeDrive’s pipeline being undisclosed as commercially sensitive.
We think the methodology holds up on its own terms: full data disclosure, an independent teacher panel in the Physics study, and a published conflict-of-interest statement. We would rather you read the papers yourself and judge that than take our summary of it.
Accuracy, in short.
- Has GradeDrive's AI marking accuracy been independently tested?
- Yes. Two case studies, led by GradeDrive's Ismail Bozdag with independent researcher Dr Manting Qiu, compared GradeDrive's marks against official AQA mark schemes for GCSE Physics and A-level Mathematics. Both are posted on SSRN and disclose Ismail's GradeDrive affiliation as a conflict of interest on their first page.
- What does the 99.2% accuracy figure measure?
- It's how often a mark GradeDrive suggested survived a teacher's review unchanged: across summer 2026, 99.2% of 216,000 marks over 2,300 submissions were left as GradeDrive first suggested. It's drawn from our own production database, not an independent benchmark against an exam board or chief examiner.
- What did the SSRN case studies find?
- Against official AQA marks on deliberately contentious examiner-training material, GradeDrive scored a quadratic-weighted kappa of 0.885 (77.5% exact agreement) on GCSE Physics, and 0.864 (70.3% exact agreement) on A-level Mathematics.
- What is quadratic-weighted kappa?
- A standard statistic assessment researchers use to measure agreement between two markers, correcting for the agreement expected by chance. Both SSRN studies report it alongside other measures, including ICC, Pearson correlation, mean absolute error, and Bland-Altman limits of agreement.